Setup PHP Debugging in PHPStorm
Posted on April 11th, 2017
After struggling with this basic task each time I need to debug a new project, I’ve written this guide for my specific environment; debugging a PHP website using XDebug and PHPStorm.
Server Settings
First on the webserver (in my case a seperate CentOs box):
[CONFIRM: May need to install xdebug with:
# pecl install xdebug
and add line:
zend_extension = /usr/lib/php/modules/xdebug.so
to php.ini ]
Connect with FTP, edit the file: /etc/php.d/xdebug.ini
Make sure your local computer is set as a remote host (fully qualified dell-xxxx.domain):
xdebug.idekey="PHPSTORM"

xdebug.remote_enable=1

xdebug.profiler_enable_trigger=1

xdebug.remote_host="dell-xxxxx.domain"

xdebug.remote_port=9000

xdebug.remote_mode=req
Next, connect with PuTTy and restart the http service:
service httpd restart
PHPStorm
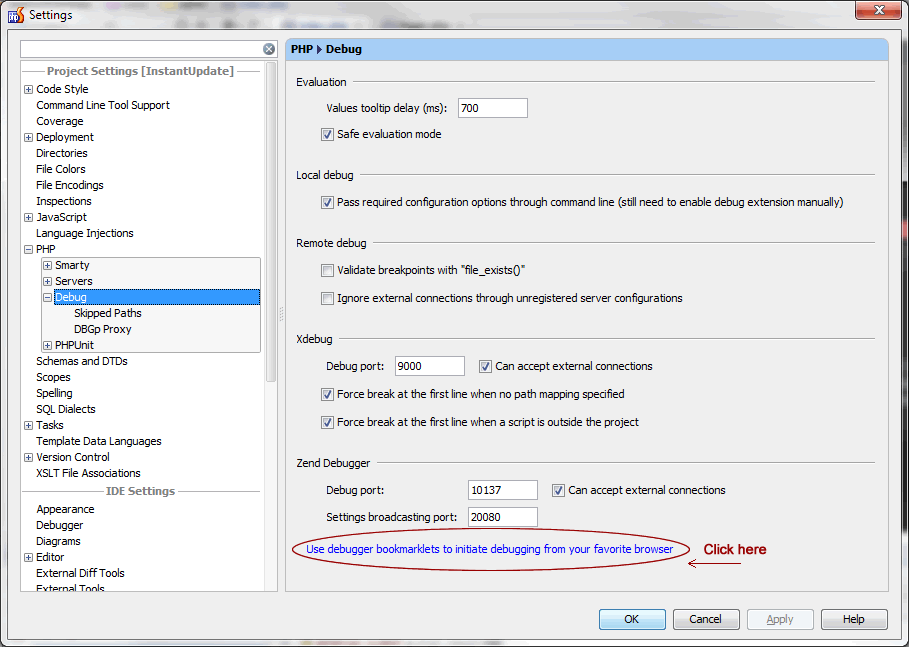
Open PHPStorm (4.0.3), File -> Settings, under PHP -> Debug my settings are as follows:
Click the link indicated to setup your browser…
Browser
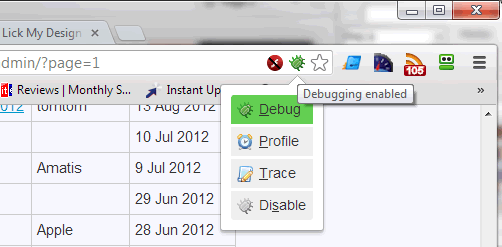
In my case chrome opens up with the Zend or XDEbug options – I chose xdebug and dragged the “Start debugger”, “Stop debugger” and “Debug this page” links to my quicklinks bar. You should also see a new bug icon to the right of the address bar (may need to restart the browser):

Back to PHPStorm…
PHPStorm Cont…
Next under File -> Settings -> PHP -> Debug -> DBGp Proxy set the following:

(I know the port is different – but it still works?!)
Next click the red phone icon to start Listen Debug Connections, set a breakpoint in a file, then back in your browser refresh the page.
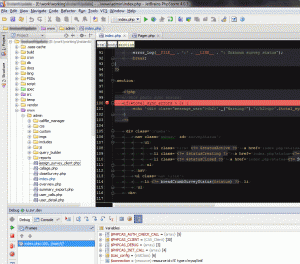
If all has gone to plan, PHPStorm should spring to life showing the debug information:

